Missense predictions | Splicing module | Micro-RNA predictions

|
|
Table of Contents
: In silico predictions
: Missense predictions | Splicing module | Micro-RNA predictions |
|
Alamut® Visual includes a splicing module integrating a number of prediction algorithms and splicing prediction data:
A number of enhancements to the splicing module have been computed over the years:
This method is based on position weight matrices computed from a set of human constitutive exon/intron junctions for donor (both GT and GC) and acceptor sites (see below).
Alamut® Visual uses the matrix described by Zhang et al. (1998) for branch points and the algorithms described in Shapiro et al. (1987).
MaxEntScanis a method based on the Maximum Entropy principle, developed by the Burge Lab at MIT and described in Yeo et al., 2004. The MaxEntScan splice site datasets and algorithms are fully integrated inside Alamut® Visual, with permission from Christopher Burge.
Alamut® Visual only reports scores from the Maximum Entropy Model.
NNPLICE (available at the Berkeley Drosophila Genome Project web site) is a prediction method based on neural networks (Reese et al. 1997). Although not fully integrated inside Alamut® Visual, it is transparently queried from within the software.
Alamut® Visual reports scores from NNSPLICE 0.9.
GeneSplicer is an Open Source software available from the University of Maryland CBCB. GeneSplicer combines several splice site detection techniques, among which Markov models (Pertea et al. 2001).
Alamut® Visual reports in the splicing module each occurrence of the 9-mers (3 exonic + 6 intronic nucleotides) found in the donor subset of human constitutive exon/intron junctions (see below), and each occurrence of the 6-mers (4 intronic + 2 exonic) found in the acceptor subset. Acceptor 6-mers are reported only where at least 6 of the 8 upstream nucleotides are pyrimidines.
Using exoribonuclease digestion and targeted RNA-sequencing to enrich for sequences that traverse the lariat junction and, by split and inverted alignment, Mercer et al. (2015) identified 59,359 high-confidence human branchpoints in >10,000 genes, thus providing a first map of splicing branchpoints in the human genome.
The ESEFinder method computes putative binding sites for Exonic Splicing Enhancers (Cartegni et al., 2003). We have embedded the ESEFinder matrices (licensed from Cold Spring Harbor Laboratory) inside Alamut® Visual so as to perform the same computation as that provided by the CSHL ESEFinder web site.
In the RESCUE-ESE approach, specific hexanucleotide sequences are identified as candidate ESEs (Fairbrother et al., 2002). The set of human hexamers available from the RESCUE-ESE web site is embedded inside Alamut® Visual.
EX-SKIP compares the ESE/ESS profile of a wild-type and a mutated allele to quickly determine which exonic variant has the highest chance to skip this exon. It calculates the total number of ESSs, ESEs and their ratio. Specifically, it computes the number of RESCUE-ESEs (Fairbrother et al., 2004; Fairbrother et al., 2002), FAS-ESSs (Wang et al., 2004), PESEs/PESSs (Zhang et al., 2004), neighbourhood inference (Stadler et al., 2006) and EIE/IIEs (Zhang et al., 2008) for each segment.
The EX-SKIP tool is available, through the Alamut® Visual pre-filled form functionality, from the menu bar of the "Splicing Effects" window after displaying ESE predictions (see below).
We have gathered a set of human constitutive exon/intron junction sequences as follows. 10,728 human mRNA sequences from the RefSeq database (as of Dec. 2007), with status 'reviewed', were mapped onto the human reference genome (NCBI 36). Based on this mapping, genomic exon/intron boundary sequences were extracted into separate subsets for donor and acceptor sites.
With these sequences, we have built three position weight matrices: two matrices for donor sites (GT and GC sites), and one matrix for acceptor sites (AG sites). See sequence logos below.
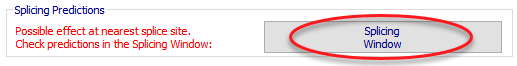
To open the splicing window, click the 'Splicing Window' button from the variant annotation window:
The splicing window shows up:

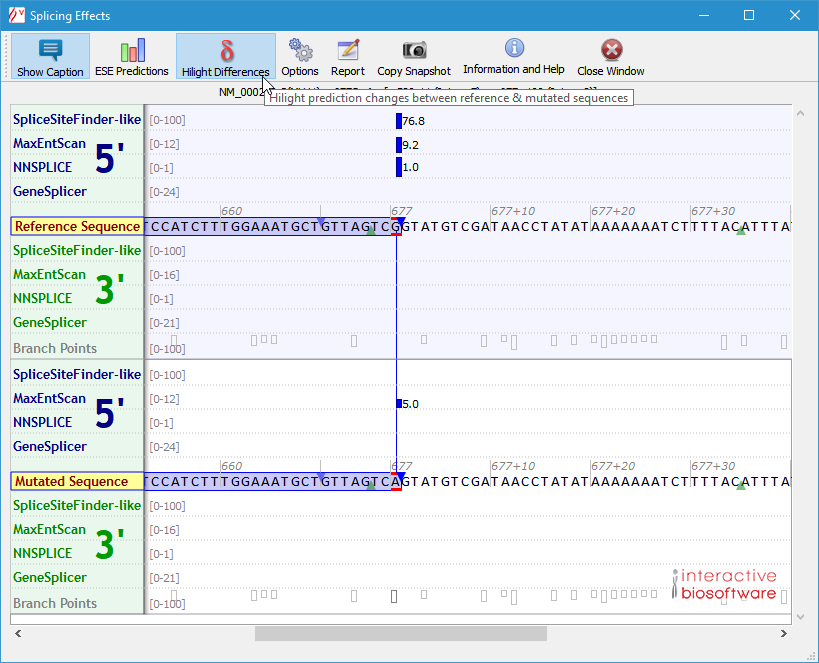
The window displays the reference (wild-type) and mutated sequences (in the range displayed in the main window when the Splicing button was clicked) and predictions are reported above and under each one. Exons are drawn as blue boxes.
Hits from SpliceSiteFinder-like, MaxEntScan, NNSPLICE and GeneSplicer are displayed as blue vertical bars for 5' (donor) sites, and as green vertical bars for 3' (acceptor) sites. The height of each bar is proportional to the maximum possible score computed by the corresponding algorithm.
Known constitutive signals are displayed as small blue (5') or green (3') triangles, close to the sequence letters.
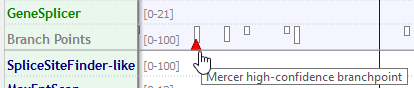
Mercer et al. high-confidence branchpoints are displayed as red triangles in the Branch Points sub-track of the Reference Sequence.
When moving the mouse over each vertical bar or triangle, a tooltip appears with the corresponding score. You can display score numbers for each hit bar by just clicking the bar itself.
![]() The region for which predictions are computed corresponds to the range displayed in the main window
when the Splicing button was clicked.
Therefore, if you wish to extend this region you need to unzoom the display before.
The region for which predictions are computed corresponds to the range displayed in the main window
when the Splicing button was clicked.
Therefore, if you wish to extend this region you need to unzoom the display before.
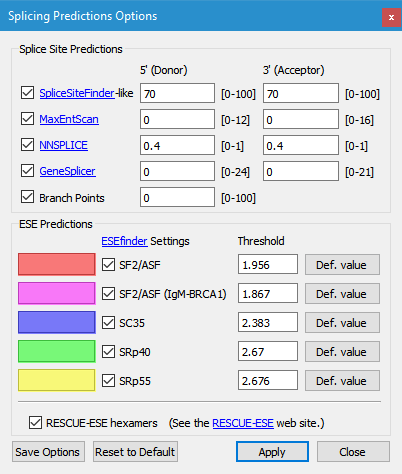
Use the Options window to select which predictions to display and to modify thresholds.
To reveal differences between wild-type and mutated scores, click on the 'Highlight Differences' button. Unchanged scores get dimmed, while score numbers are displayed beside those that differ:
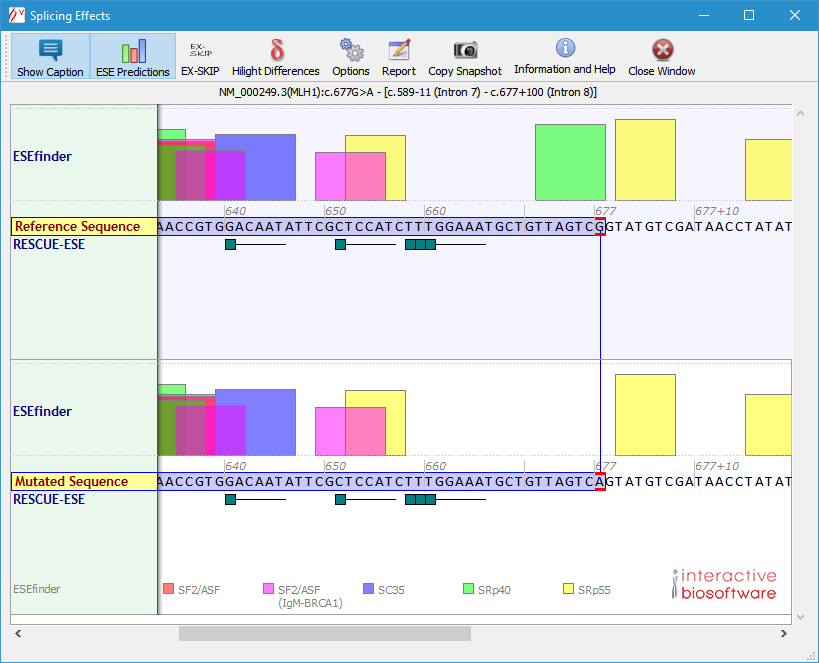
To display ESE predictions, click the "ESE Predictions" button. ESE hits from ESEfinder are displayed above each sequence, and RESCUE-ESE hexamers are drawn under them:
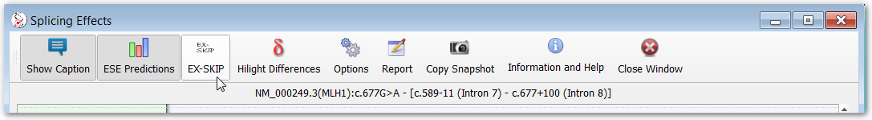
To launch the EX-SKIP tool, click the "EX-SKIP" button. The "EX-SKIP" button is dislayed after clicking the "ESE predictions" button).
The pre-filled web form of the EX-SKIP tool is displayed in a new window. Input sequences are created as follows by Alamut Visual: only exonic sequences are take into account with up to 30 exonic nucleotides before or after the variant position within the exon.
![]() Users may also refer to a book chapter presenting in silico splice tools integrated in Alamut® Visual:
In silico prediction of
splice-affecting nucleotide variants in
In Silico Tools for Gene Discovery, Springer, 2011.
Users may also refer to a book chapter presenting in silico splice tools integrated in Alamut® Visual:
In silico prediction of
splice-affecting nucleotide variants in
In Silico Tools for Gene Discovery, Springer, 2011.
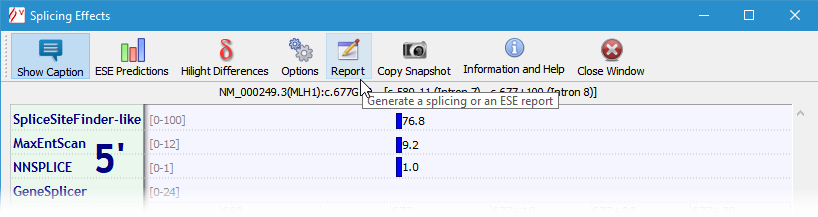
To generate a tabular report of splicing signals predictions, click the 'Report' button. The report is generated in HTML web format. It can be later opened and edited by most word processors.
Starting with Alamut® Visual 2.2 (released June 2012), a report is also available for ESE predictions.
Cartegni et al. ESEfinder: A web
resource to identify exonic splicing enhancers.
Nucleic Acids
Res (2003) vol. 31 (13) pp. 3568-71
Fairbrother et al. Predictive
identification of exonic splicing enhancers in human genes.
Science
(2002) vol. 297 (5583) pp. 1007-13
Hellen Splice Site Tools: A Comparative Analysis Report.
NGRL Manchester Report 2009.
Houdayer et al. Guidelines
for splicing analysis in molecular diagnosis derived from a set of
327 combined in silico/in vitro studies on BRCA1 and BRCA2 variants.
Hum Mutat. 2012 Aug;33(8):1228-38.
Mercer at al. Genome-wide discovery of human splicing branchpoints.
Genome Res (2015) 25(2): 290-303.
Pertea et al. GeneSplicer: a new
computational method for splice site prediction.
Nucleic Acids
Res (2001) vol. 29 (5) pp. 1185-90
Raponi, M., Kralovicova, J., Copson, E., et al. Prediction of single-nucleotide
substitutions that result in exon skipping: identification of a splicing silencer in BRCA1 exon 6..
Hum Mutat. (2011), 32, 436-444.
Reese et al. Improved Splice Site Detection in Genie.
J
Comp Biol (1997) vol. 4 (3), pp. 311-23
Shapiro, M. B. and P. Senapathy (1987).
RNA splice junctions of different classes of eukaryotes: sequence statistics and functional implications in gene expression.
Nucleic Acids Res 15(17): 7155-7174.
Yeo et al. Maximum entropy modeling
of short sequence motifs with applications to RNA splicing signals.
J
Comput Biol (2004) vol. 11 (2-3) pp. 377-94
Zhang et al. Statistical features of
human exons and their flanking regions.
Hum Mol Genet (1998)
vol. 7 (5) pp. 919-32
These sequence logos (computed by enoLOGOS) depict the position weight matrices used by the SpliceSiteFinder-like algorithm in Alamut® Visual.
![]()
![]()
![]()
![]()
© 2020 Interactive Biosoftware - Last modified: 30 December 2017